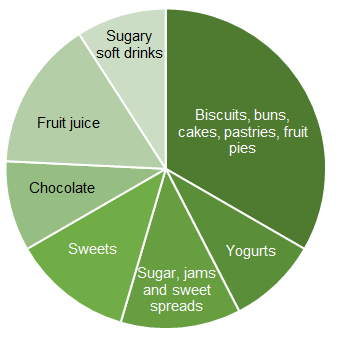
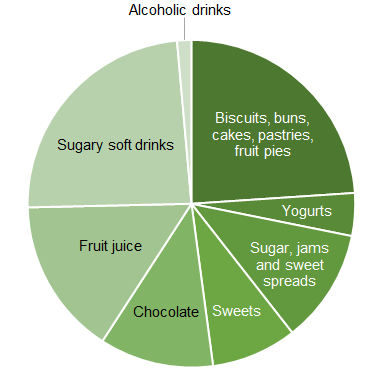
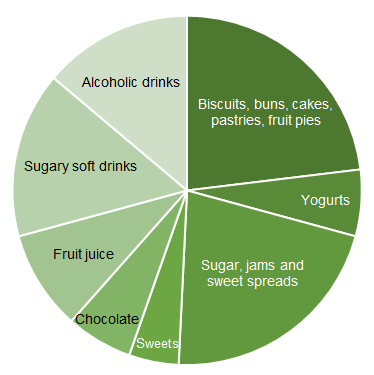
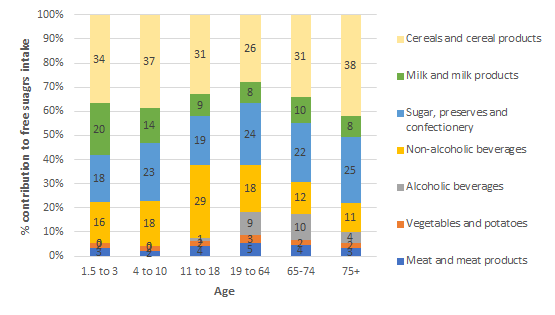
Table 4. The percentage contribution of different food groups to free sugars intakes at different ages
|
Food group
|
1.5-3 year olds
|
4-10 year olds
|
11-18 year olds
|
19-64 year olds
|
65-74 year olds
|
75+ year olds
|
|
Biscuits
|
11%
|
10%
|
9%
|
7%
|
9%
|
10%
|
|
Buns, cakes, pastries and fruit pies
|
9%
|
12%
|
8%
|
8%
|
9%
|
14%
|
|
Yogurts
|
12%
|
6%
|
3%
|
4%
|
5%
|
5%
|
|
Sugars, including table sugar, preserves and sweet spreads
|
6%
|
8%
|
8%
|
14%
|
15%
|
20%
|
|
Sugar confectionary
|
5%
|
8%
|
6%
|
3%
|
1%
|
1%
|
|
Chocolate confectionary
|
7%
|
6%
|
8%
|
4%
|
6%
|
4%
|
|
Fruit juice
|
10%
|
10%
|
11%
|
6%
|
8%
|
5%
|
|
Sugary soft drinks
|
3%
|
6%
|
17%
|
10%
|
4%
|
5%
|
|
Alcoholic drinks
|
0%
|
0%
|
1%
|
9%
|
10%
|
4%
|
The table below outlines the free sugars content of different foods per 100g and per portion.
Table 5. Approximate free sugar content of some foods that contribute to intakes
|
Food
|
Free sugars per 100g or 100ml
|
Free sugars (per portion)
|
|
Cream sandwich biscuits
|
31g
|
4.7g (15g biscuit)
|
|
Digestive biscuit
|
17.7g
|
2.7g (15g biscuit)
|
|
Lemon cake with icing or buttercream
|
42.5g
|
21.3g (50g slice)
|
|
Chocolate cake no filling or icing
|
29.6g
|
14.8g (50g slice)
|
|
Milk chocolate
|
46.7g
|
11.7g (25g)
|
|
Orange juice
|
8.6g
|
12.9g (150ml)
|
|
Fruit yogurt
|
9g
|
11.3g (125g pot)
|
|
Honey
|
75.5g
|
15.1g (20g – average spread on one slice of bread)
|
|
Table sugar
|
100g
|
4.0g (4g teaspoon)
|
Data taken from McCance and Widdowson, National Diet and Nutrition Survey dietary information and retail data
What is the effect of free sugars on health?
The key health issues associated with consumption of free sugars are dental caries and excess energy intakes, potentially leading to obesity and other cardiometabolic conditions.
Dental caries
Dental caries or tooth decay develops when bacteria in the mouth metabolise sugars or other fermentable carbohydrates, producing acid that demineralises teeth. Over time this can result in dental caries. Fluoride can help teeth resist demineralisation and regular brushing with fluoride toothpaste, as well as regular dental check-ups, can help prevent caries. Dental caries are preventable and have a negative impact on health, as well as being costly for individuals and healthcare systems.
Dental extractions remain a top reason for hospital admissions in young children in the UK. Tooth decay can be prevented with changes to diet and good oral health habits.
Ayela Spiro, Nutrition Science Manager, British Nutrition Foundation
The oral health survey of 5 year-olds in 2019 showed that about 1 in 4 children have tooth decay. Significant regional inequalities exist with children from the most deprived areas having more than twice the level of decay (34.3%), than those from the least deprived (13.7%). Extraction of decayed teeth is the most common cause for hospital admission for young children in the UK.
There were marked social variations with adults from routine and manual occupation households more likely to have tooth decay than those from managerial and professional occupational households (37% compared with 26%).
Recommendations on sugars have historically been based on the association between intakes and oral health, in particular the observation that dental caries were rare in populations with low intakes of sugars estimated to be below 10% of total energy. Several national and international authoritative bodies have reviewed evidence on free sugars and health. Outcomes of reviews from the WHO and SACN in the UK are summarised below.
WHO - evidence on dental caries:
Recommendations on sugars intake from the WHO were informed by a systematic review addressing the relationship between free sugars intake and dental caries risk in adults and children.
Overall, the evidence suggested a positive association between free sugars intake and dental caries in all ages, in developing, transitional and industrialised countries, and in all decades of publication of results.
The review highlighted that dental caries still occurred at levels of free sugars intake below 10% and further analysis of three studies (quality considered to be very low) suggested that the association persisted at intakes between 5-10% but was lower below this. As well as the main recommendation for adults and children to limit free sugars to 10% of energy, a conditional recommendation with a limit of 5% of energy from free sugars was also given by the WHO based on these data.
SACN - evidence on dental caries:
In their 2015 Carbohydrates and health review, SACN included a systematic review on the relationship between free sugars and caries. The evidence for a relationship between sugars intake and dental caries was largely derived from cohort studies along with some trials conducted in children and adolescents. Cohort studies that adjusted results for tooth brushing frequency were given more weight during consideration than those that did not.
SACN concluded that both higher consumption (amount) and frequency of sugar-containing foods and drinks are associated with a greater risk of dental caries. Although there is a paucity of studies in adults, SACN noted that the mechanism for the development of dental caries is the same as it is for children.
Obesity and other cardiometabolic conditions
Because foods and drinks that are high in free sugars tend to be palatable and energy dense, they can promote excess energy intake. This may increase the risk of weight gain and obesity, and the reduction of dietary free sugars is a key part of many national programmes to reduce obesity levels. It is important to note that energy balance and body weight are affected by many different factors at an individual and societal level and so sugar intakes are only one of these.
WHO - Evidence for free sugars and risk of excess weight gain
WHO conducted a systematic review and meta-analysis of studies on free sugars and excess weight, which found:
- Adults: An association between reduced dietary sugars intake and reduced bodyweight, and a bodyweight increase with higher consumption of dietary sugars. The overall quality of the available evidence for adults was moderate. It was suggested that the changes in energy intake were behind the increase in body weight as exchange of sugars with the same number of calories from other carbohydrates was not associated with weight change.
- Children: The randomised controlled trials (RCTs) in children that included recommendations to reduce sugar-sweetened foods and beverages had low compliance and showed no overall change in body weight. However, meta-analysis of prospective cohort studies, with follow-up times of 1 year or more, found that children with the highest intakes of sugar-sweetened beverages had a greater likelihood of being overweight or obese than children with the lowest intakes.
The authors concluded that among free living people there is evidence that intake of free sugars or sugar sweetened beverages is a determinant of body weight, with the evidence more consistent in adults than in children.
SACN - Free sugars, energy intake and weight control
SACN also considered evidence on free sugars consumption, energy intake and bodyweight in their Carbohydrates and Health report. RCTs in children and adolescents showed that consumption of sugars-sweetened drinks (compared to low calorie drinks) results in greater weight gain and increases in body mass index (BMI, weight for height). In adults, the results from meta-analysis of 11 RCTs presented evidence on diets differing in the proportion of sugars in relation to energy intake. In five of the trials, the sugars content of participants’ diets was manipulated by adjusting other sources of energy (starches, protein, and fat). In six of the trials, the amount of sugars participants consumed was altered predominantly by replacing sugars with non-caloric sweeteners, particularly in drinks.
The analysis showed an association between sugars consumption and energy intake. It showed that relative changes (increases and decreases) in sugars intake resulted in corresponding relative changes in energy intake and that there was approximately a 19kcal (78kJ) change in energy intake for each one unit change in percentage energy consumed as sugars.
The conclusion was that there is an inadequate energy compensation for energy derived from sugars; such that we do not reduce our energy from other sources if energy from sugars increases.
To quantify the dietary recommendation, SACN considered advice from a separate Calorie Reduction Expert Group which estimated that a 100kcal/person/day (418kJ/person/day) reduction in energy intake of the population would address energy imbalance and lead to a moderate degree of weight loss in most individuals. Based on this it was calculated that, to achieve this, intakes of free sugars would need to be reduced by about 5% of energy, resulting in the reduction of the recommended limit on free sugars from 10% to 5%.
Free sugars and risk of type 2 diabetes
The SACN report found that there was no association between the incidence of type 2 diabetes and total or individual sugars intake, but prospective cohort studies associated greater consumption of sugars-sweetened drinks with increased risk of type 2 diabetes.
Reformulation to reduce sugars in foods and drinks
Reformulation can be an effective public health strategy to reduce population intakes of nutrients of concern. Much work has been done to reduce the sugar content of a range of foods and drinks and this remains an area of focus.
It is important to note that sugar plays many roles aside from adding sweetness. These include to:
- Provide body to drinks
- Provide texture, structure and mouthfeel to products
- Produce colour and flavour when they react with other ingredients
- Preserve foods, for example jams and canned fruit and vegetables
- React with yeast in fermentation, for example rising dough, alcohol production
- Reduce the freezing point (important for producing softer ice creams) and increase the boiling point (important in manufacture of sweets).
In many cases, sugars cannot easily be replaced by a single ingredient in foods, which can deliver all the same functions. The impact of sugars reduction on the calorie content of a product depends on what sugars are replaced with. In the case of drinks, where sugars can be partially or completely replaced by low calorie sweeteners then calories can be significantly reduced. However, if sugars are replaced by starches, then the calorie content of the product will remain the same and if the fat content of the product increases as a proportion, then the calorie content per 100g may increase.
Policy actions to reduce free sugars intake
Reduction of free sugars in the diet is high on the global public health nutrition agenda and advice to limit foods and drinks high in free sugars is part of most national food-based dietary guidelines. Sugar-sweetened drinks are a key focus with about 40 countries worldwide implementing some kind of tax on these products.
In the UK, the soft drinks industry levy (SDIL) was introduced in 2018, obliging soft drinks manufacturers to pay a levy on drinks with over 8g added sugars/100g and a reduced levy for drinks with more than 5g added sugars/100g. The levy appears to have accelerated efforts to reformulate sugar-containing drinks. A study looking at the composition of drinks from 2015-2019 found that by 2019, the proportion of drinks over the lower levy sugar threshold had fallen by 34%. Analysis of purchasing trends in households suggests the volume of soft drinks has remained similar to before the introduction of the levy but that the sugars in those drinks are about 10% lower.
Across the four countries of the UK, policy actions focussed on reducing childhood obesity have targeted sugar reduction. In England, the sugar reduction programme launched in 2015 aimed to reduce sugars in 10 food categories by 20% by 2020 in the retail, manufacturing and out of home sectors. The categories covered are:
- Biscuits
- Breakfast cereals
- Cakes
- Chocolate confectionery
- Ice cream, lollies and sorbets
- Morning goods (like pastries, buns and waffles)
- Puddings (including pies and tarts)
- Sweet confectionery
- Sweet spreads and sauces
- Yogurt and fromage frais.
Progress has not met these expectations across all the categories. The latest report covering 2015-2019 found that overall in the retail and manufacturing sectors there had been little change since 2015 with an overall reduction in sugar content across the categories of 3 percent. Some categories made more progress with yogurts and fromage frais down 12.9%, and breakfast cereals down 13.3%. In the out of home sector there was little change overall although sugars in breakfast cereals were reduced by 17% in this period. At the time of writing there had not been any further reports on progress with the sugar reduction programme. There are also other policies, including those restricting promotions of high fat, salt and sugar foods, where news is currently awaited from the government.
Key References
Moynihan, PJ & Kelly SA (2014) Effect on caries of restricting sugars intake: systematic review to inform WHO guidelines. Journal of Dental Research, 93(1), 8–18. https://doi.org/10.1177/0022034513508954
SACN (2015) Carbohydrates and Health report. Available at: https://assets.publishing.service.gov.uk/government/uploads/system/uploads/attachment_data/file/445503/SACN_Carbohydrates_and_Health.pdf
Te Moringa, Mallard & Mann (2013) Dietary sugars and body weight: systematic review and meta-analyses of randomised controlled trials and cohort studies. British
Medical Journal 346:e7492 https://doi.org/10.1136/bmj.e7492
WHO (2015) Guideline: Sugars intake for adults and children. Available at: https://www.who.int/publications/i/item/9789241549028